Last Updated on by Tree of Wealth
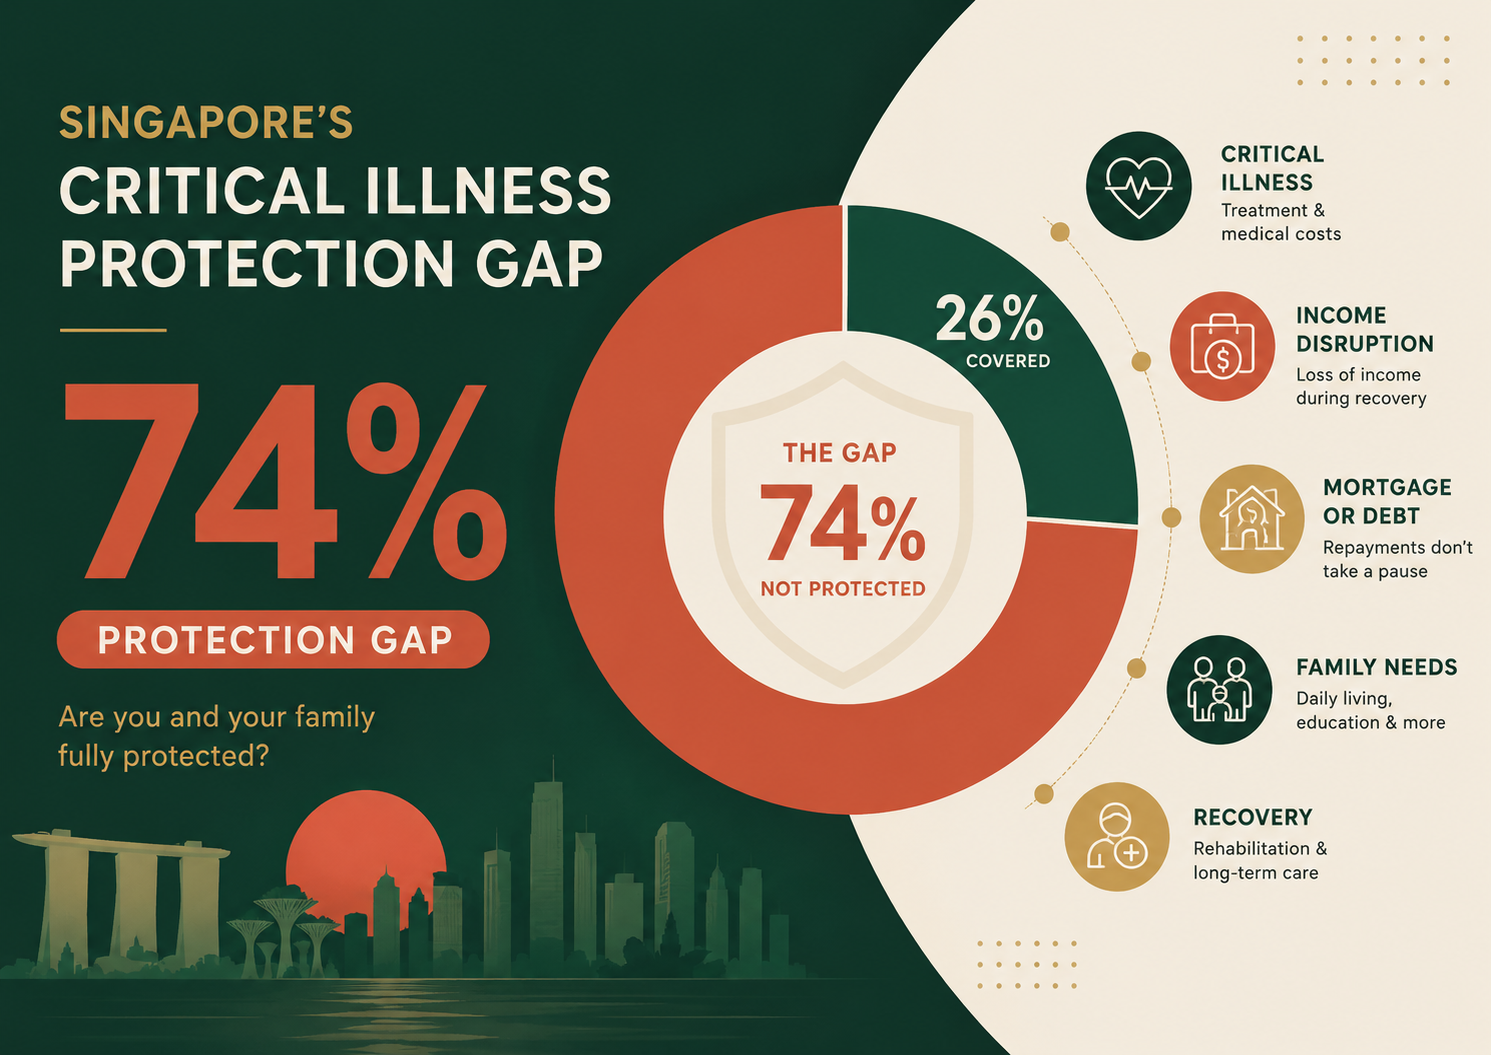
Singapore’s critical illness protection gap was estimated at 74% in the Life Insurance Association Singapore’s Protection Gap Study 2022.
That does not mean 74% of Singaporeans have no critical illness insurance.
It means that, under the study’s population-level model:
- Total CI financial needs were estimated at S$783 billion
- Existing individual and group CI insurance amounted to S$204 billion
- The remaining shortfall was S$579 billion, or 74%
The study was published in September 2023 using data and assumptions as at 31 December 2021. It should therefore be treated as an important reference—not a real-time measurement of every Singapore household today.
Singapore’s CI protection gap at a glance
| Measure | Study estimate |
|---|---|
| Total CI protection need | S$783 billion |
| Existing individual and group CI insurance | S$204 billion |
| CI protection gap | S$579 billion |
| Financial need met by CI insurance | 26% |
| Financial need not met | 74% |
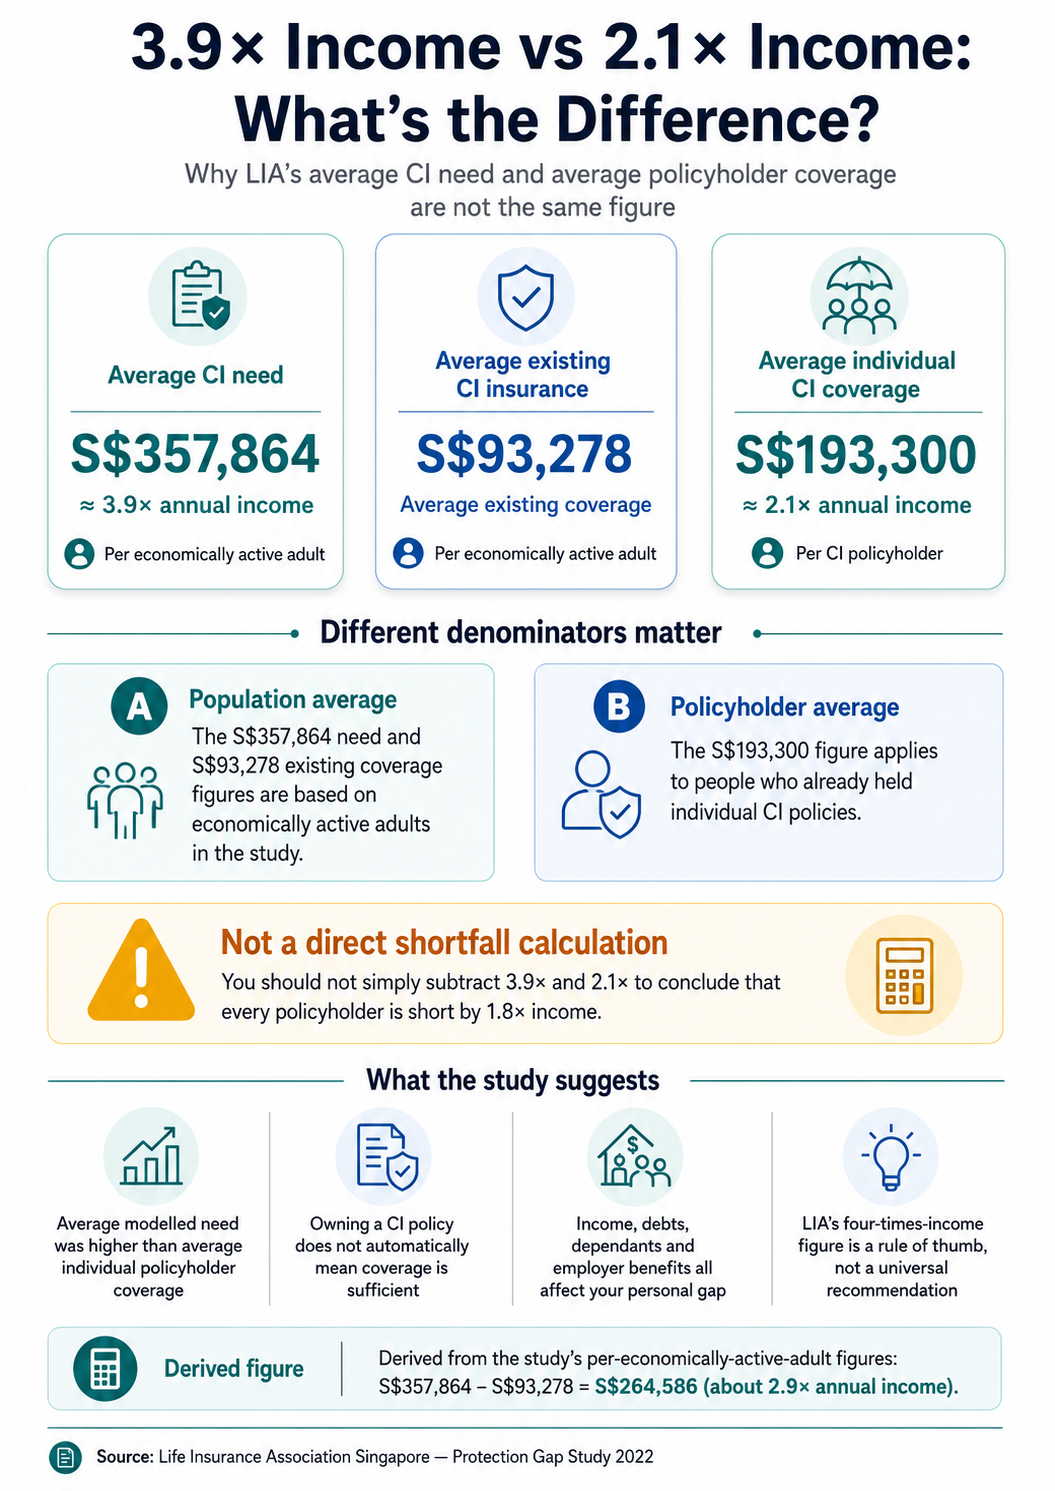
| Average CI need per economically active adult | S$357,864 |
| Average existing CI coverage per economically active adult | S$93,278 |
| Average modelled gap per economically active adult | S$264,586 |
Expressed simply:
For every S$100 of modelled CI financial need, approximately S$26 was met by existing CI insurance, leaving S$74 as the gap.
This is an aggregate estimate. It does not mean every individual personally lacks exactly 74% of the coverage they need.
Who was included in the study?
The main study population comprised economically active Singapore citizens and Permanent Residents who were:
- Aged 20 to 69
- Economically active
- Supporting at least one dependant
The estimated population was approximately 2.19 million economically active adults.
The findings should not be applied mechanically to retirees, homemakers, unemployed adults or people without dependants. These groups may still have substantial CI needs, but the study was not designed specifically around them.
What financial needs did the study include?
The study did not treat critical illness as merely a hospital-bill problem.
It considered broader needs such as:
- Ongoing household expenditure
- Housing and personal loans
- Rent
- Financial support for children
- Support for elderly parents
- Replacement of unpaid household services
- Income available from an economically active spouse
This is important because someone may leave hospital while still being unable to resume normal work, income or family responsibilities.
Why did LIA use a five-year recovery period?
The study used an assumed five-year CI recovery period when modelling many expenses.
That does not mean every person will be hospitalised, receiving treatment or unable to work for exactly five years.
LIA defined recovery broadly as the period from diagnosis until the person is able to return to work. Actual outcomes may include:
- Continuing to work during treatment
- Taking several months of medical leave
- Returning on reduced hours
- Losing commissions or bonuses
- Moving into a lower-paying role
- Changing occupation
- Remaining permanently unable to work
Survey respondents expected an average recovery period of approximately 3.4 years, which was shorter than the study’s five-year modelling assumption. The comparison suggests that people may focus mainly on treatment duration, while the model also considered longer-term financial and employment effects.
Five years does not mean five years of salary
The study did not simply multiply annual income by five.
Different categories of need were calculated differently. The model considered household expenses, debts, spouse income and dependant needs.
That is why the resulting average CI need was:
- S$357,864
- Equivalent to approximately 3.9 times annual income
LIA communicated this more simply as an approximate four-times-income rule of thumb.
It is a starting benchmark, not a requirement that everyone must purchase exactly four times their salary.
3.9 times income needed vs 2.1 times held
The study also reported that people who already owned individual CI policies held average individual coverage of approximately:
- S$193,300
- Equivalent to around 2.1 times annual income
At first glance, someone may calculate:
3.9× need − 2.1× coverage = 1.8× shortfall
That is not a like-for-like comparison.
The two figures use different denominators.
| Figure | Who it refers to |
|---|---|
| S$357,864 or 3.9× income | Economically active adults in the study |
| S$93,278 existing coverage | Economically active adults in the study |
| S$193,300 or about 2.1× income | People who already owned individual CI policies |
The S$193,300 figure excludes people without individual CI policies.
The more comparable calculation is:
S$357,864 average need − S$93,278 average existing coverage = S$264,586 average modelled gap per economically active adult
That is equivalent to a derived gap of approximately 2.9 times annual income.
It is still not a recommendation that every person should buy another S$264,586 of insurance.
Why is coverage higher per policyholder?
Consider four people:
- Person A has S$200,000 of CI coverage
- Person B has S$200,000
- Person C has none
- Person D has none
Average among policyholders:
S$400,000 ÷ 2 = S$200,000
Average across all four people:
S$400,000 ÷ 4 = S$100,000
The same pool of insurance creates a higher average when only policyholders are counted.
This is why S$193,300 should not be described as the average CI coverage of every Singaporean.
Why was the mortality gap only 21%?
The same study estimated:
- A 21% mortality protection gap
- A 74% critical illness protection gap
The difference is not simply because Singaporeans owned more death insurance.
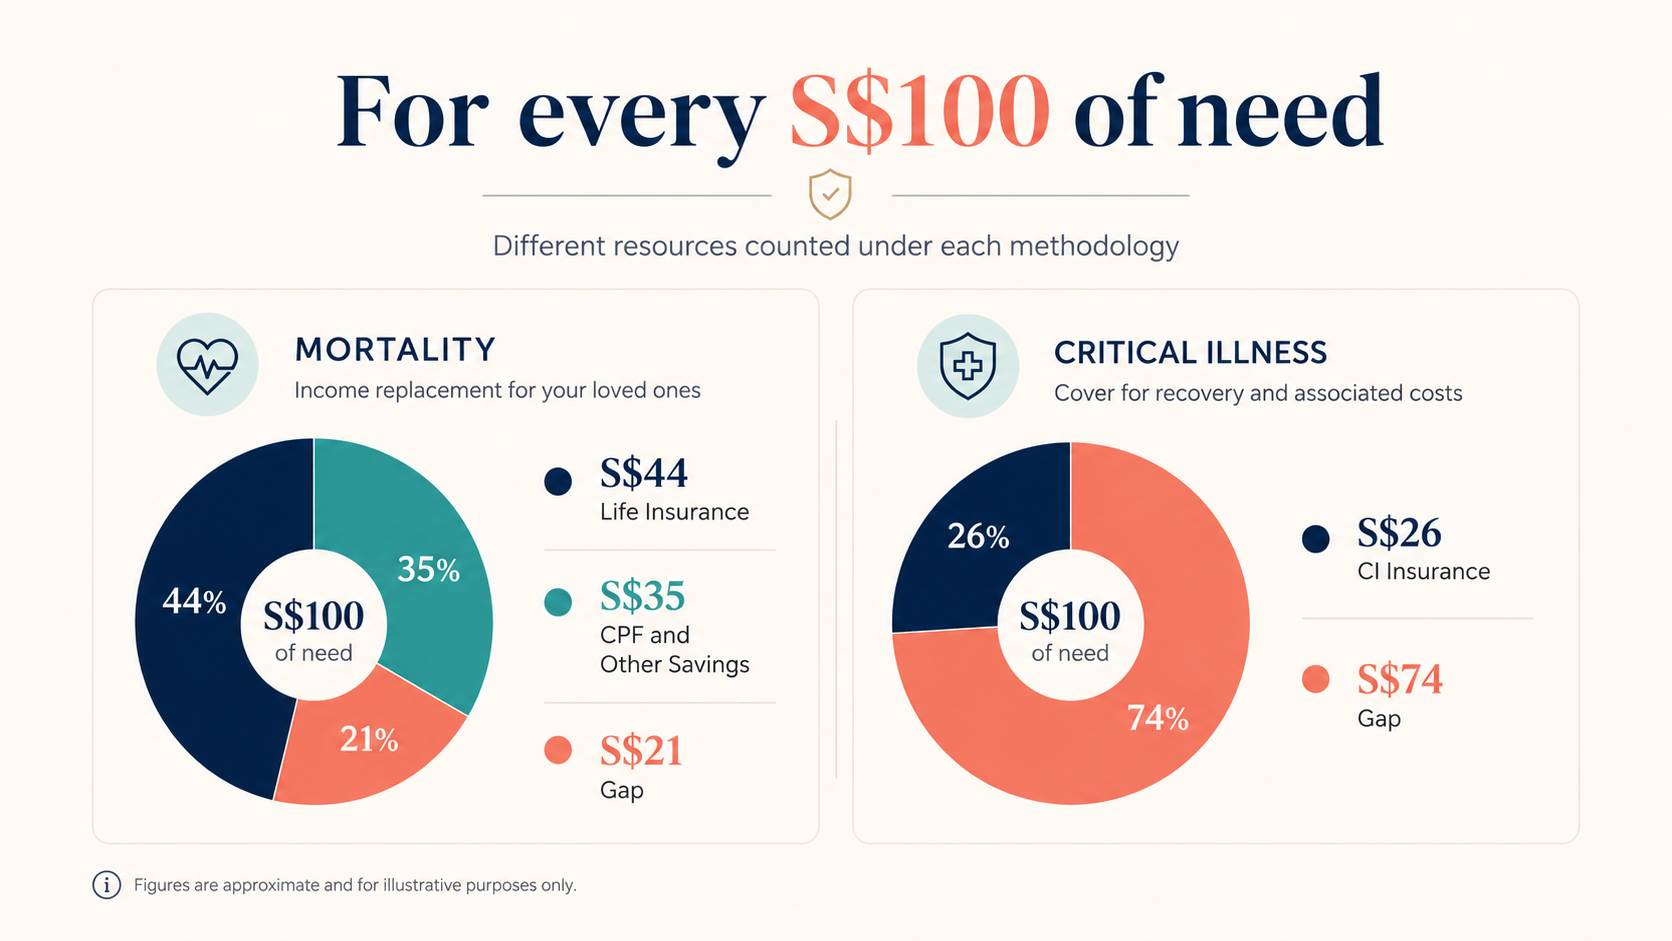
The two calculations counted different resources.
| Protection Gap Study 2022 | Mortality | Critical illness |
|---|---|---|
| Total protection need | S$1.781 trillion | S$783 billion |
| Insurance counted | S$787 billion | S$204 billion |
| CPF and other savings counted | S$621 billion | Not counted |
| Remaining gap | S$373 billion | S$579 billion |
| Gap percentage | 21% | 74% |
For mortality, the study counted:
- Individual and group life insurance
- CPF savings
- Other savings, including cash and deposits
For critical illness, it counted individual and group CI insurance but excluded CPF and personal savings under its methodology.
That difference is a major reason the mortality gap appeared much smaller.
Why were savings excluded from the CI calculation?
The study assumed that:
- MediSave would help meet immediate medical needs
- Remaining CPF savings were generally unavailable for ordinary living expenses during recovery
- Other personal savings were still needed for retirement and later-life needs
This was a modelling assumption.
It does not mean individuals cannot use:
- Cash savings
- Fixed deposits
- Investments
- Spouse income
- Business income
- Other accessible assets
However, using those resources may affect retirement, education funding, business capital or other important goals.
The more relevant personal question is:
How much of your savings is genuinely available for illness without creating another financial shortfall later?
Did the study include hospital bills?
The study assumed that immediate hospitalisation and surgery expenses were adequately addressed through:
- MediShield Life
- MediSave
- An Integrated Shield Plan
Its CI calculation therefore focused mainly on wider recovery needs such as household expenses, debts and dependant support.
This was not a guarantee that every medical expense would be fully reimbursed.
Actual hospital coverage depends on the applicable policy terms, including:
- Deductibles
- Co-insurance
- Claim limits
- Eligible treatments
- Exclusions
- Rider provisions
- Hospital and ward choice
A hospital plan generally helps reimburse eligible medical expenses.
CI insurance generally pays a lump sum after a covered illness or procedure satisfies the contractual claim requirements.
They address different financial problems.
Has Singapore’s CI protection improved?
Yes, although the remaining gap was still substantial.
| Study | CI needs | Existing CI insurance | CI gap | Gap percentage |
|---|---|---|---|---|
| 2017 | S$663 billion | S$125 billion | S$538 billion | 81% |
| 2022 | S$783 billion | S$204 billion | S$579 billion | 74% |
Between the two studies:
- CI coverage increased by approximately two-thirds
- Average individual CI coverage per policyholder rose from about S$128,900 to S$193,300
- The percentage gap improved from 81% to 74%
- The absolute dollar gap still increased from S$538 billion to S$579 billion
The percentage improved because insurance coverage grew.
The dollar gap increased because total financial needs also rose.
Why owning a CI policy may still not be enough
Policy ownership and sufficient protection are not the same thing.
A policy may have been purchased before:
- A major salary increase
- A larger mortgage
- The birth of children
- Responsibility for elderly parents
- A move into self-employment
- Higher household expenses
- A reduction in employer benefits
For example, S$150,000 of coverage equals three times income when someone earns S$50,000 annually.
If their income later rises to S$90,000, the same benefit represents only about 1.7 times income.
The policy has not necessarily become bad. It simply may not have kept pace with the person’s life.
Do not add every policy figure automatically
A policy may show:
- S$100,000 severe-stage CI
- S$50,000 early-stage CI
- S$100,000 death benefit
That does not necessarily mean S$250,000 is available for one illness.
Depending on the contract:
- An early-stage claim may reduce the severe-stage benefit
- A CI payout may reduce the death benefit
- Several claims may share one maximum limit
- Employer coverage may disappear after leaving the job
The LIA Critical Illness Framework standardises the severe-stage definitions of 37 listed illnesses.
It does not standardise:
- Early-stage definitions
- Multiple-claim structures
- Benefit amounts
- Coverage duration
- Waiting or survival periods
- Whether benefits are accelerated or additional
Your usable coverage must be confirmed from the actual policy contracts.
How to review your own CI protection gap
1. Start with a broad benchmark
Annual income × 4
Use this as an initial screening estimate, not an automatic purchase amount.
2. Identify usable CI benefits
Review:
- Personal severe-stage coverage
- Early and intermediate-stage benefits
- Employer CI coverage
- Whether payouts overlap
- Whether one claim reduces another
- Coverage expiry ages
3. Identify other dependable resources
These may include:
- Paid medical leave
- Sustainable spouse income
- Cash reserved specifically for illness
- Investments genuinely available for recovery
- Disability-income benefits
- Business income that can continue
4. Adjust for your actual responsibilities
Consider:
- Mortgage and personal loans
- Essential household expenses
- Children
- Elderly parents
- Caregiving costs
- Income volatility
- The risk of returning to work at a lower income
Your actual requirement may be above or below four times annual income.
Frequently asked questions
Does a 74% CI gap mean only 26% of Singaporeans own CI insurance?
No. It means existing CI insurance met approximately 26% of the aggregate financial need estimated by the study.
Does the S$579 billion gap include personal savings?
No. CPF and other personal savings were excluded from the CI resources under the study’s methodology.
Does everyone need four times annual income in CI insurance?
No. Four times income is a population-level starting benchmark. Existing insurance, savings, debts, dependants and income stability should be considered.
Does a five-year recovery period mean five years without working?
No. Someone may continue working, return part-time or move into a different role while still experiencing reduced income.
Is the 74% figure current in 2026?
The study was published in 2023 using data and assumptions as at 31 December 2021. It should not be presented as a live measurement of Singapore’s current position.
Should an older CI policy be replaced if the benefit appears low?
Not automatically.
Replacement may involve new underwriting, exclusions, waiting periods, higher premiums or loss of existing contractual benefits. Retaining and supplementing the policy may sometimes be more appropriate.
Final thoughts
Singapore’s 74% critical illness protection gap does not mean 74% of people have no CI insurance.
It means that, under LIA’s national model, existing individual and group CI insurance met approximately 26% of the estimated financial need created by critical illness.
The most useful lessons are:
- The gap measures dollars, not the percentage of people insured
- The four-times-income benchmark is a starting point, not a fixed prescription
- The 3.9-times need and 2.1-times policyholder coverage figures use different denominators
- The five-year recovery period is a modelling assumption, not a forecast for everyone
- Savings were excluded from the CI calculation but may still form part of personal planning
- Owning a CI policy does not prove the amount remains adequate today
The real question is:
If your income were disrupted for several years, how much usable money would your current policies and resources actually provide?
Your CI policy may exist—but would it last as long as the financial impact?
A policy purchased years ago may now represent much less of your income, while your mortgage, children, household expenses and dependence on your salary have increased.
A proper review can show how much usable CI coverage you actually have, whether employer benefits may disappear and how quickly your savings could be depleted if recovery takes longer than expected.
This article is for general information only and does not constitute personalised financial advice. Insurance needs and suitability depend on individual circumstances and the applicable policy terms.
Sources
- Life Insurance Association Singapore — Protection Gap Study 2022
- Life Insurance Association Singapore — Protection Gap Study 2022: Key Findings
- Life Insurance Association Singapore — Protection Gap Study 2022: Public FAQ
- Life Insurance Association Singapore — Official Protection Gap Study Release
- Life Insurance Association Singapore — Critical Illness Framework 2024